According to our research, visually impaired people have difficulties involving food and nutrition, including checking food expiration dates, monitoring food freshness, calculating nutritional value, and finding recipes. These issues can cause an inability to manage their own food and lead to health problems.
This project aims to understand the challenges faced by visually impaired individuals regarding food, utilize AI to propose a potential solution, and evaluate the success of our prototype through statistical analysis.
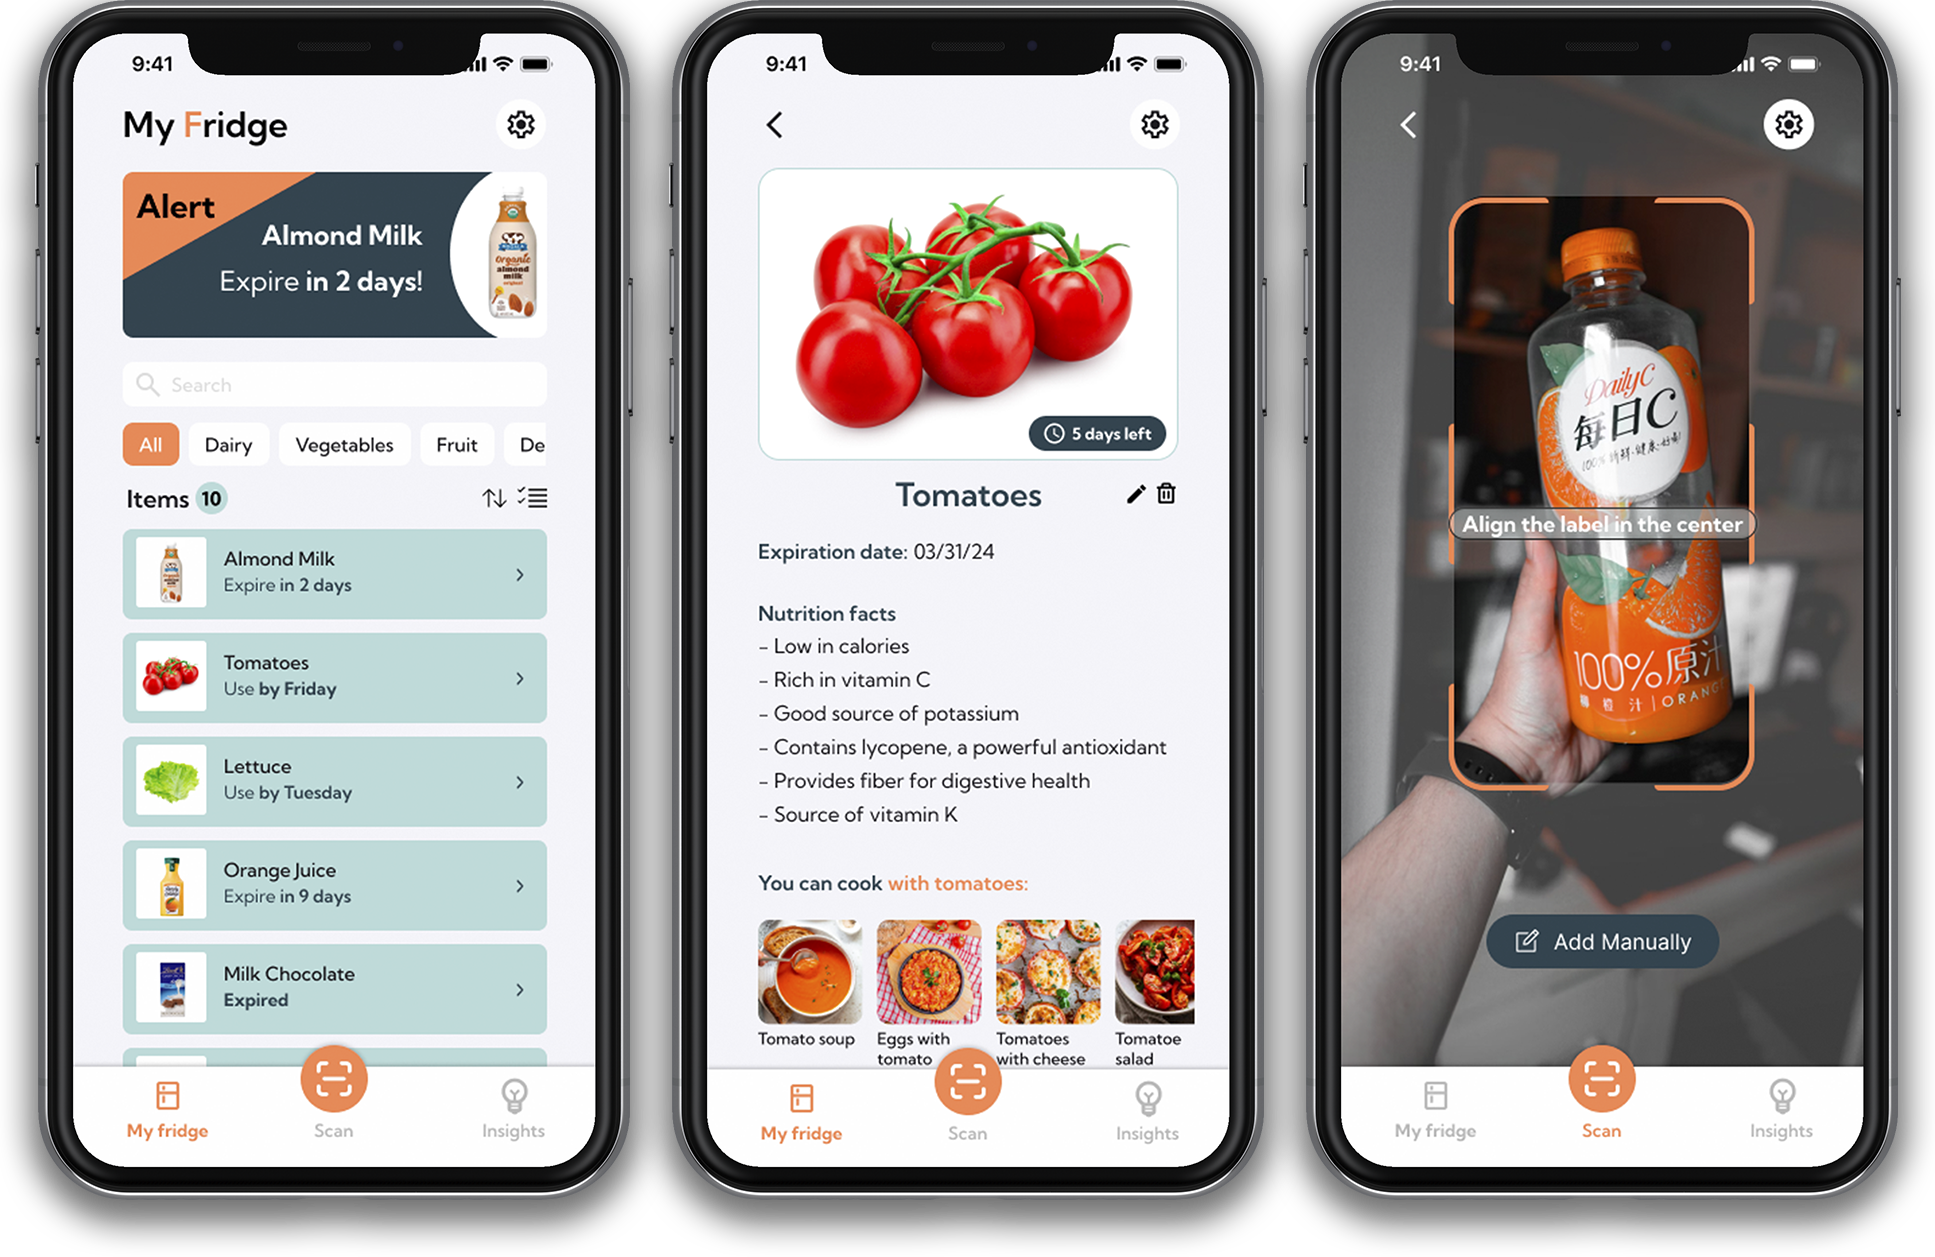
We began by researching health and well-being problems that we believed could be improved with a product incorporating AI. We wrote a proposal to create a mobile app that uses AI to aid visually impaired and blind individuals with food-related issues. We titled the app FridgeBrain and envisioned the product would help keep track of the food in one’s refrigerator and their expiration dates and assist with nutrition.
After completing our background research, we brainstormed ideas to address these issues and began wireframing an app using Figma. We created a high-fidelity prototype with five screens to showcase our proposed features for the FrideBrain app. The app included seven features we planned to analyze: food storage listing, expiration alerts, nutritional suggestions, recipe suggestions, food scanning, voice interaction assistant, and insights provided by the AI assistant.

The next step was to test our prototype to gather data. We designed a survey using Google Forms consisting of two demographic questions, five preference and user habit questions, and eight questions to gather measurements for our dependent variables. The preference and user habit questions are aimed at gathering data on topics relating to the app’s features such as the frequency of finding expired food in one’s fridge. The measurement questions asked the participants to rank the helpfulness of the feature and their satisfaction on a scale of 1 to 5. The prototype was presented to our participants through a demo video.
Single Factor Design
32
Use of FridgeBrain app
My group and I calculated the mean of each measurement and found that the average perceived helpfulness and satisfaction ratings ranged from 3.66 to 4.28 out of 5. We also completed linear regressions on each perceived helpfulness rating with each related preference or user habit measurement. However, every regression had a low correlation so we did not take them into account. Based on our high averages for all the measurements of our dependent variables, we concluded that our prototype was successful.


We compiled all our work and created a presentation showcasing our entire process and data. This presentation allowed us to communicate to our peers how our research is important, how our data and findings can be applied, and what the next steps of the app could be.

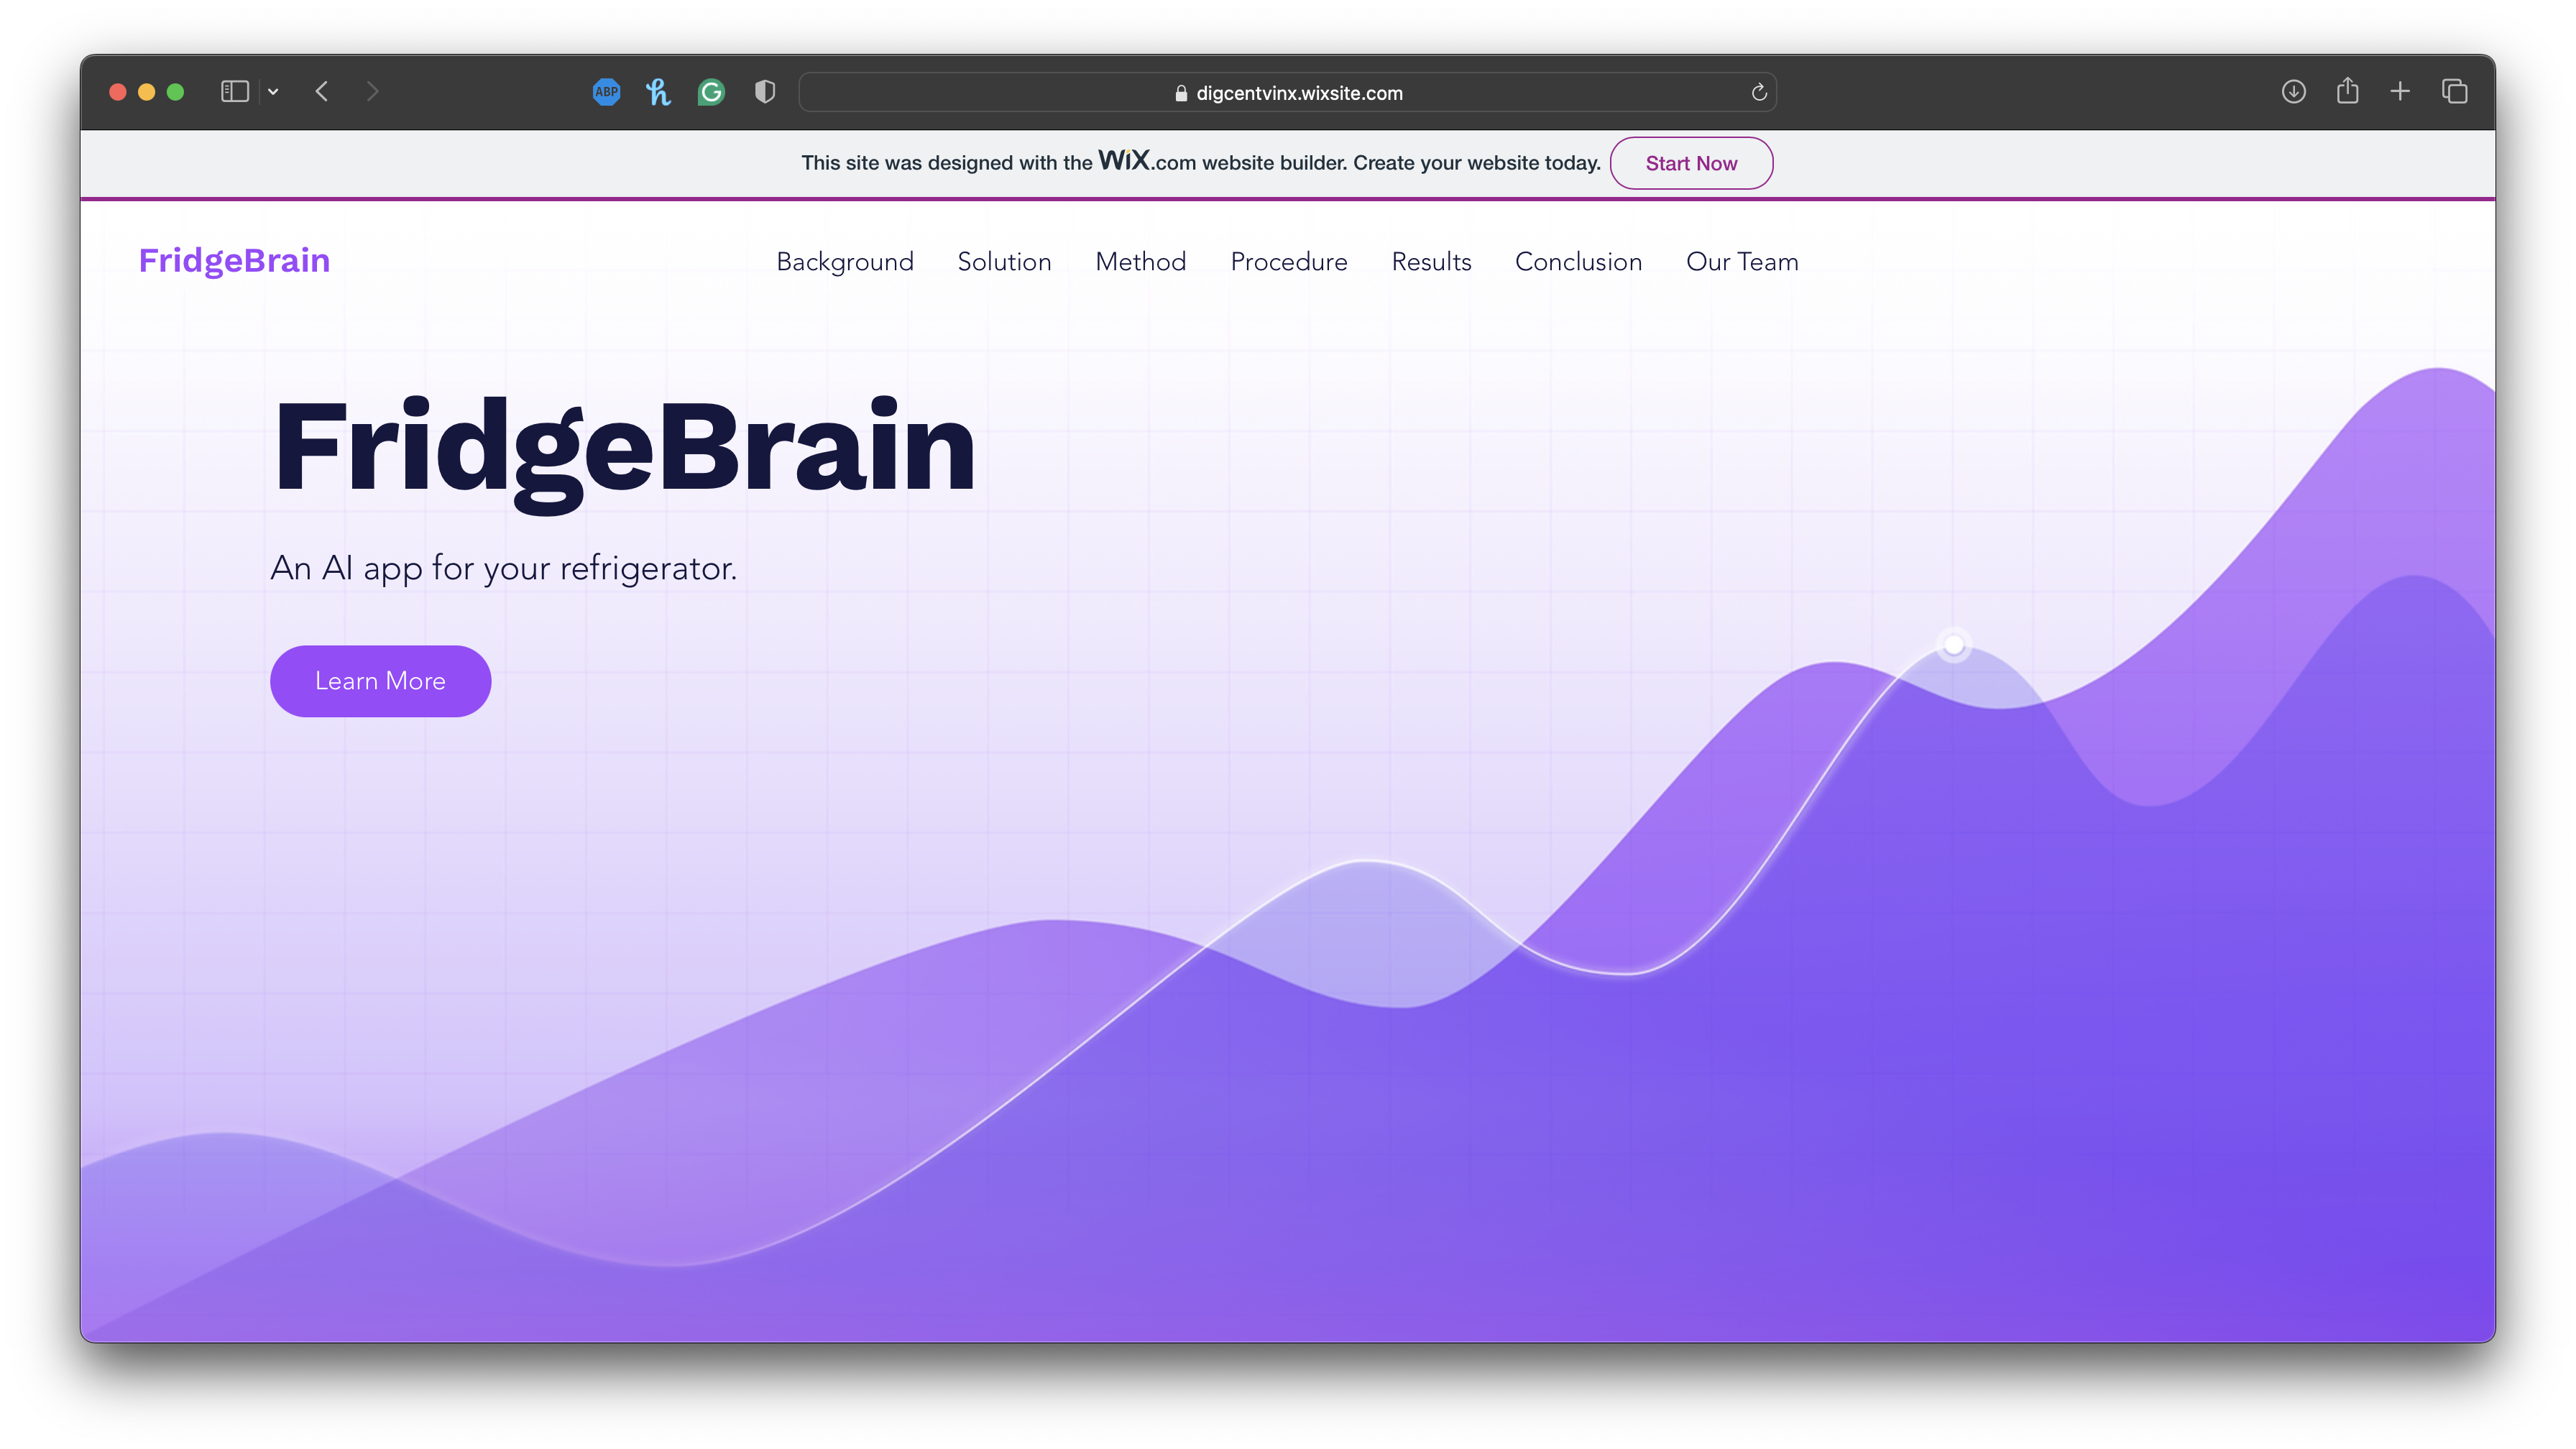
In addition to organizing our project into a presentation, we also displayed our work on a webpage. Along with my group, I created and designed a website on Wix.com to include the same information as our presentation. This allows our findings to be viewed at any time and shows our ability to present information using different formats.
Based on our analysis, our prototype was successful in addressing food-related issues. However, our project had several limitations that could be improved upon. We were not able to receive feedback from blind or visually impaired individuals or test the prototype on them due to a lack of screen-reading/accessibility functions. Because of these limitations on our data, we cannot determine definitively if our solution is successful for the visually impaired. If we were to move forward, we would like to correct these issues and continue to test our solution to more accurately assess its success.